FULL ACCESS STARTS HERE
Start saving time and money now!
You will love using this resource
SCARD025.jpg
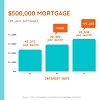 This social image uses a graph to illustrate the difference in loan repayments as interest rates rise. It uses a $500,000 mortgage over 25 years as the example, with repayments on interest rates of 3%, 5% and 7% shown.
Social cards are available in .png or .jpg format. To download this image, you must be logged in to the Financial Library.
These social cards are only available to our lucky library subscribers!
To download and use this content, make sure you're logged in to the Library then hit the Download button.
No login details? Register here for full access.